EventTracker: Dashboard
Development of the EventTracker analytics interface, Landingi’s built-in tool for monitoring user behaviour on landing pages. The project covered migrating EventTracker to the new SPA and developing the Overview and Events tabs in the landing page dashboard.
 – enlarge
Where it started
EventTracker collected behavioural data from published landing pages, but users needed a convenient way to analyse it without relying on external tools. The dashboard had to present both high-level page results — visits, conversions and leads — and detailed information about individual events.
As the new SPA grew, the existing functionality also needed to be migrated and the analytics interface further developed.
The challenge
I was responsible for migrating EventTracker to the new SPA and developing its interface together with the team. I worked primarily on two dashboard tabs: Overview, presenting a summary of landing page results, and Events, enabling detailed event analysis. My task was to implement new views, integrate with the API, handle filtering and present data in tables and charts.
How I built it
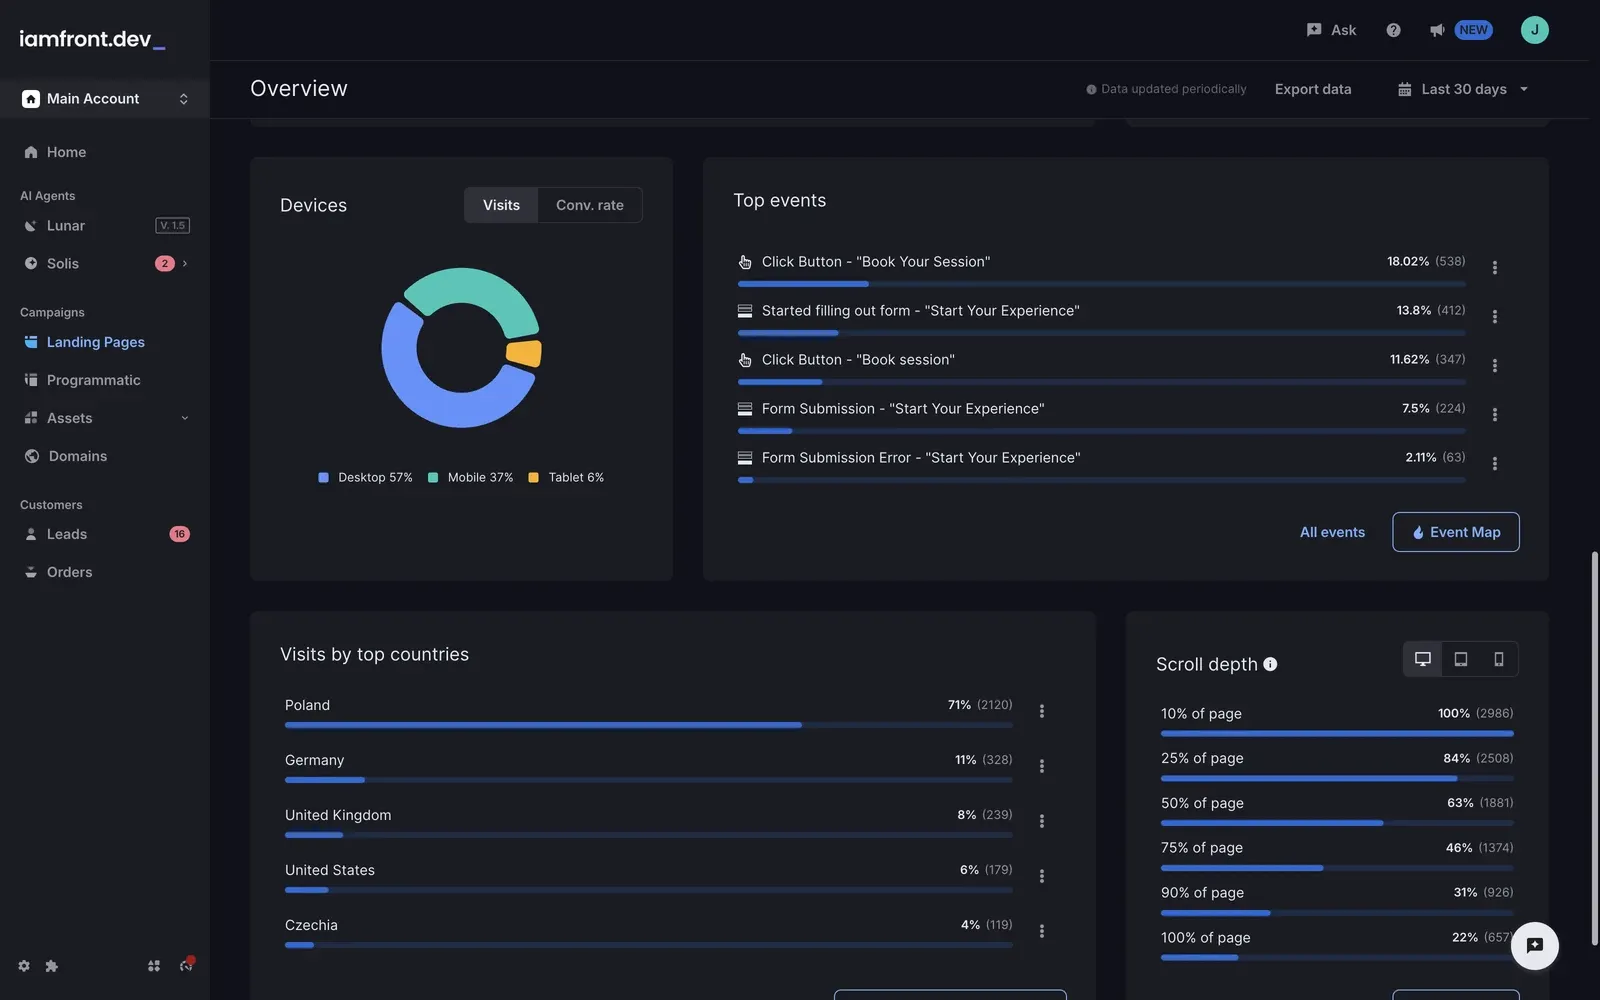
On the Overview tab I built the device statistics panel and developed the Top Events and Scroll Depth sections, showing the most frequent events and page scroll depth. I also added conversion goal selection with dynamic event loading and an average time-on-page panel covering both visibility and user activity, broken down by device.
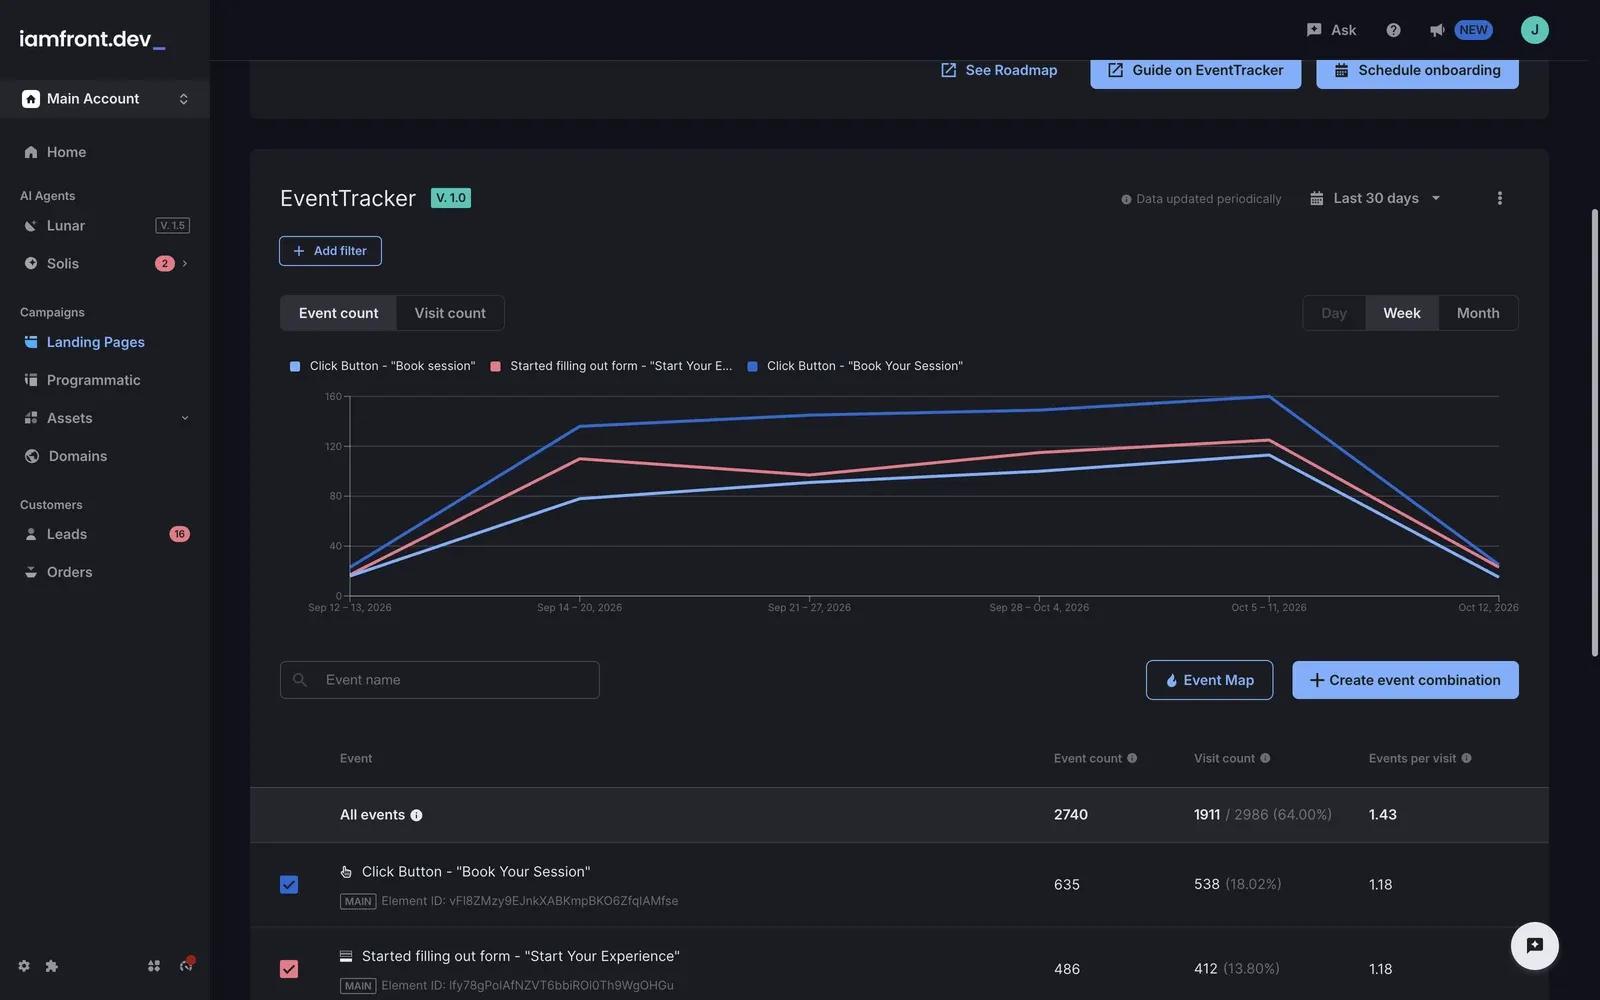
On the Events tab I developed interactive event and visit charts using Recharts and an event table with server-side pagination and expandable row details. I also implemented Combined Events functionality for grouping events, with form handling, modals and user permission support.
I implemented filter and date range management via URL parameters so the selected settings were shared between the Overview and Events tabs. Filtering covered devices, countries, languages, UTM campaigns, page types and A/B test variants.
I also developed the Google Analytics 4 integration, adding an event forwarding configuration panel. I implemented data export, interactive tours with react-joyride and automated tests in Vitest and Testing Library.
The outcome
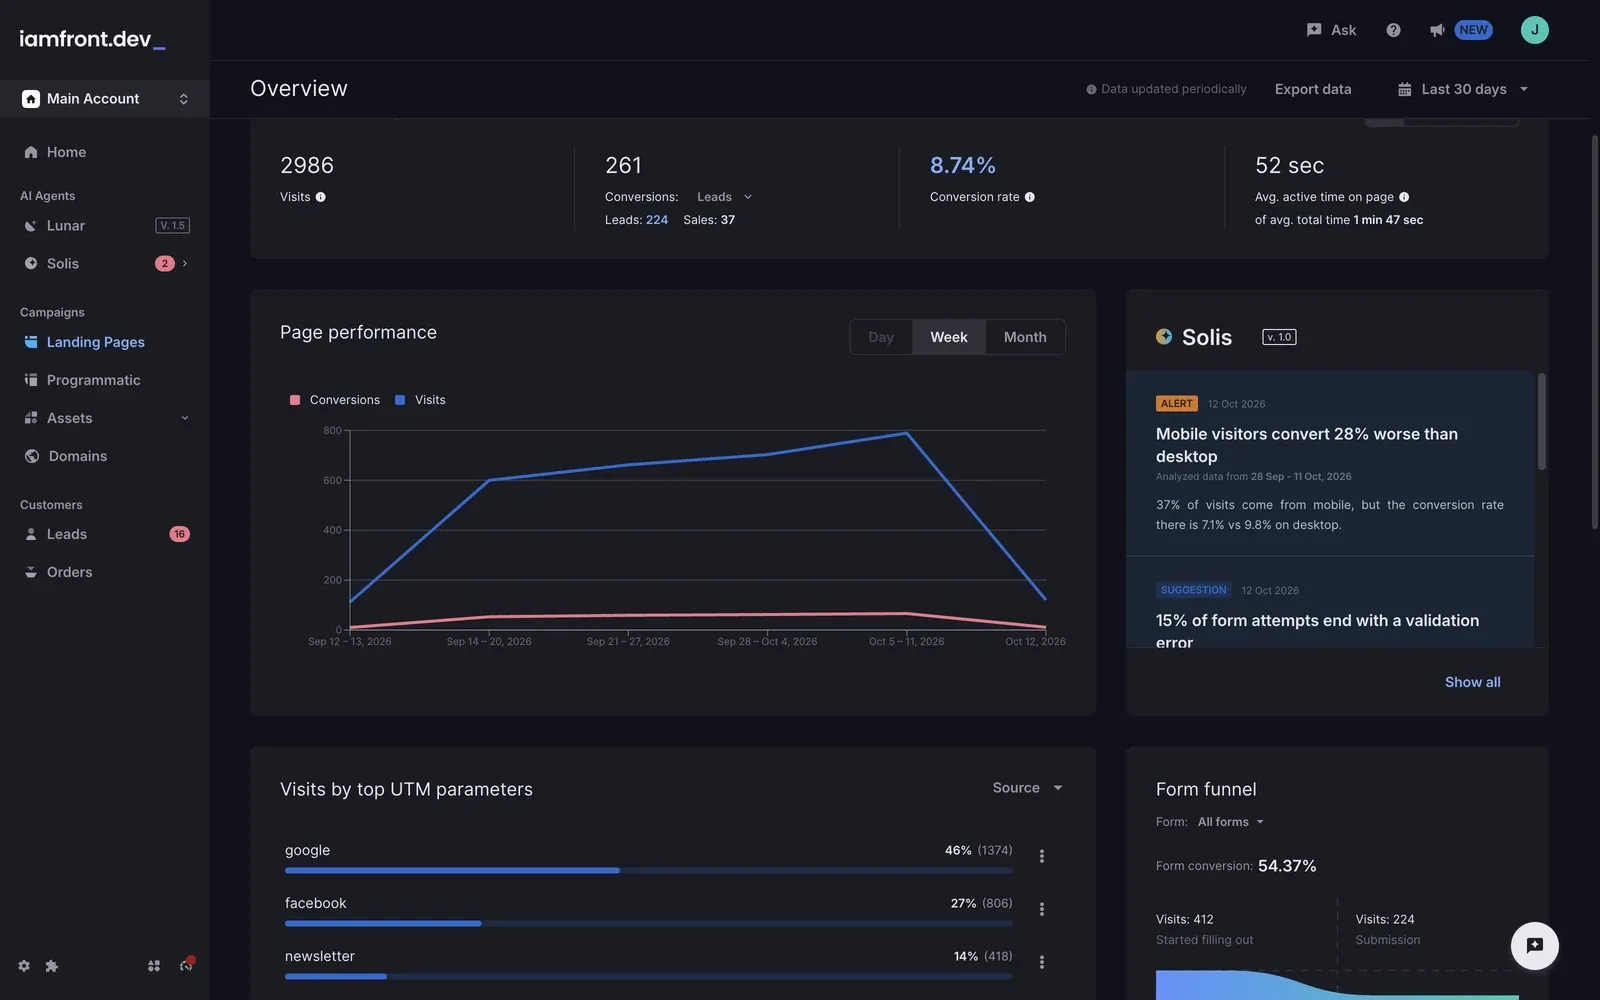
The result is a comprehensive analytics interface in the new SPA that lets users analyse landing page results and visitor behaviour in one place. The Overview tab provides a clear summary of visits, conversions, leads, sales and user engagement, while Events allows detailed filtering, combining and exporting of events and integration with Google Analytics 4.
Shared filtering and interactive visualisations make it easier to compare data and evaluate landing page performance.